DATA SCIENCE
DATA SCIENCE
“Data Science” is an Inter-Disciplinary subject involving Mathematics, Statistics, Business acumen, Python, Machine Learning and Deep Learning etc., Using “Data Science”, we can analyse information which is collected or gathered from various sources of information and give an accurate solution to the problem in hand. With the help of Data Science, useful insights can be attained, related to the problems of Business, Society, Science and Technologies etc. Data Science helps Business Organisations or Companies to develop Business Strategies, leverage their Resource utilization, take accurate business decisions etc., Business Organisations can rein in their Cost of Production, increase Efficiencies, identity new Market Opportunities for their Products and achieve Competitive Advantage over their Competitors.

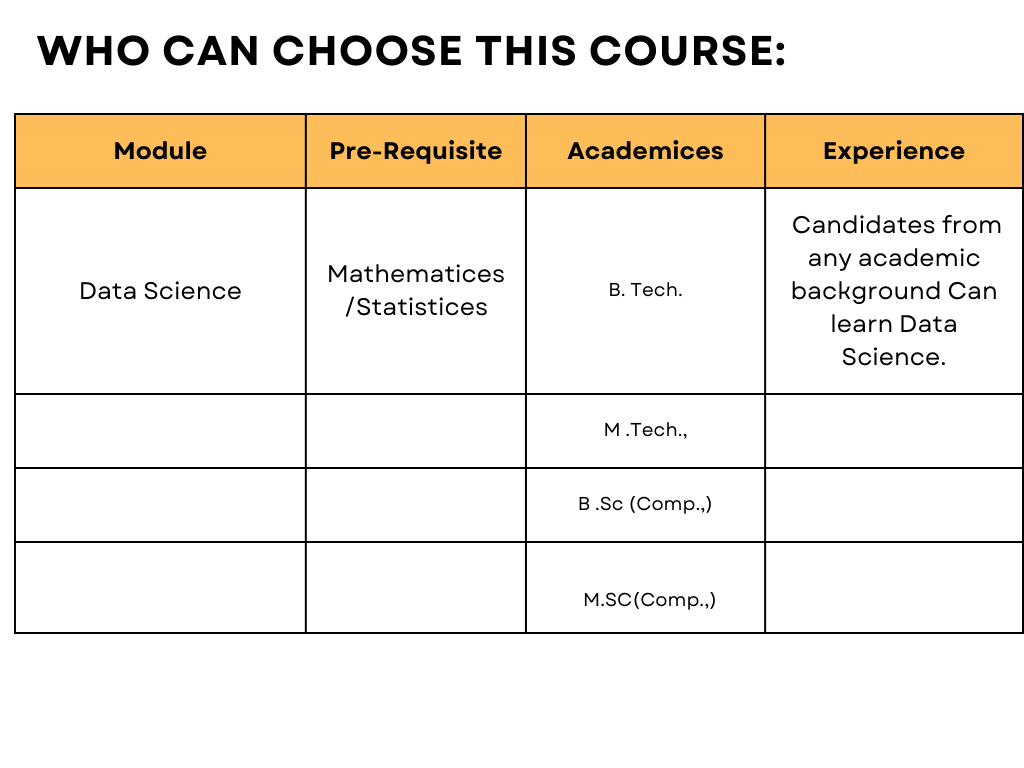
Eligibility for a course typically depends on the following:
- Prerequisites: Required prior courses or skills.
- Level of Study: Undergraduate, graduate, or continuing education.
- Program Requirements: Specific to your major or program.
- Open Enrollment: Available to all students as an elective.
- Special Permissions: Might need instructor or department approval.
- Availability: Limited seats may give priority to certain students.
- Location/Delivery: Online or specific campus availability.
Check the course catalog or consult with an academic advisor for specifics.

DATA SCIENCE – Course Content
Introduction
• What is Data Science?
• What are the key skills required to pursue Data Science?
• Why Data is the new oil and AI is the new electricity?
• How Data Science is changing the real-world applications at exponential rate ?
• Where Data Science can make miracles and change the face off the industry ?
• When to declare yourself as a Data Scientist ? or a Data Analyst ?
• Real world applications – Hands on experience
• Deployment of end to end Data Science project
Computation with Excel
Excel Introduction
Excel Get Started
Excel Overview
Excel Syntax
Excel Ranges
Excel Fill
Excel Move Cells
Excel Add Cells
Excel Delete Cells
Excel Undo Redo
Excel Formulas
Excel Relative Reference
Excel Absolute Reference
Excel Arithmetic Operators
Excel Parentheses
Excel Functions
Excel Formatting
Excel Format Painter
Excel Format Colors
Excel Format Fonts
Excel Format Borders
Excel Format Numbers
Excel Format Grids
Excel Format Settings
Excel Data Analysis
Excel Sort
Excel Filter
Excel Tables
Excel Conditional Format
Excel Highlight Cell Rules
Excel Top Bottom Rules
Excel Data Bars
Excel Color Scales
Excel Icon Sets
Excel Manage Rules (CF)
Excel Charts
Table Pivot
Table Pivot Intro
Excel Functions
AND
AVERAGE
AVERAGEIF
AVERAGEIFS
CONCAT
COUNT
COUNTA
COUNTBLANK
COUNTIF
COUNTIFS
IF
IFS
LEFT
LOWER
MAX
MEDIAN
MIN
MODE
NPV
OR
RAND
RIGHT
STDEV.P
STDEV.S
SUM
SUMIF
SUMIFS
TRIM
VLOOKUP
XOR
Excel How To
Create an Income Statement
Create a Task to-do list
Create a Balance Sheet
Real world Projects
Introduction to Excel
Learn Data Calculations
Learn Data Visualization
Learn to Create a Budget
Learn to Create a Timeline
Learn to Style in Excel
Excel Online Learning Resources
Excel Keyboard Shortcuts
Programming Essentials with Python
Python Intro
Python Get Started
Python Syntax
Python Comments
Python Variables
Python Data Types
Python Numbers
Python Casting
Python Strings
Python Booleans
Python Operators
Python Lists
Python Tuples
Python Sets
Python Dictionaries
Python If…Else
Python While Loops
Python For Loops
Python Functions
Python Lambda
Python Arrays
Python Classes/Objects
Python Inheritance
Python Iterators
Python Polymorphism
Python Scope
Python Modules
Python Dates
Python Math
Python JSON
Python Rage
Python PIP
Python Try…Except
Python User Input
Python String Formatting
